Analytics
Understand where your business wins and loses in real time

Understand where your business wins and loses in real time

Real-time information
Detects growth opportunities
Improved decision making
Identify the most profitable areas of your business and those that require improvement through analysis by locations, products and departments.
Easily assign your invoices and contacts to categories or projects and monitor their performance for greater control and improved business management.
Get a clear and detailed view of your revenues and expenses with the analytical dashboard to uncover growth opportunities for your business.

Know which service, location or department generates the most benefits
Maximize the profitability of your projects
Make decisions without having to wait for accounting reports
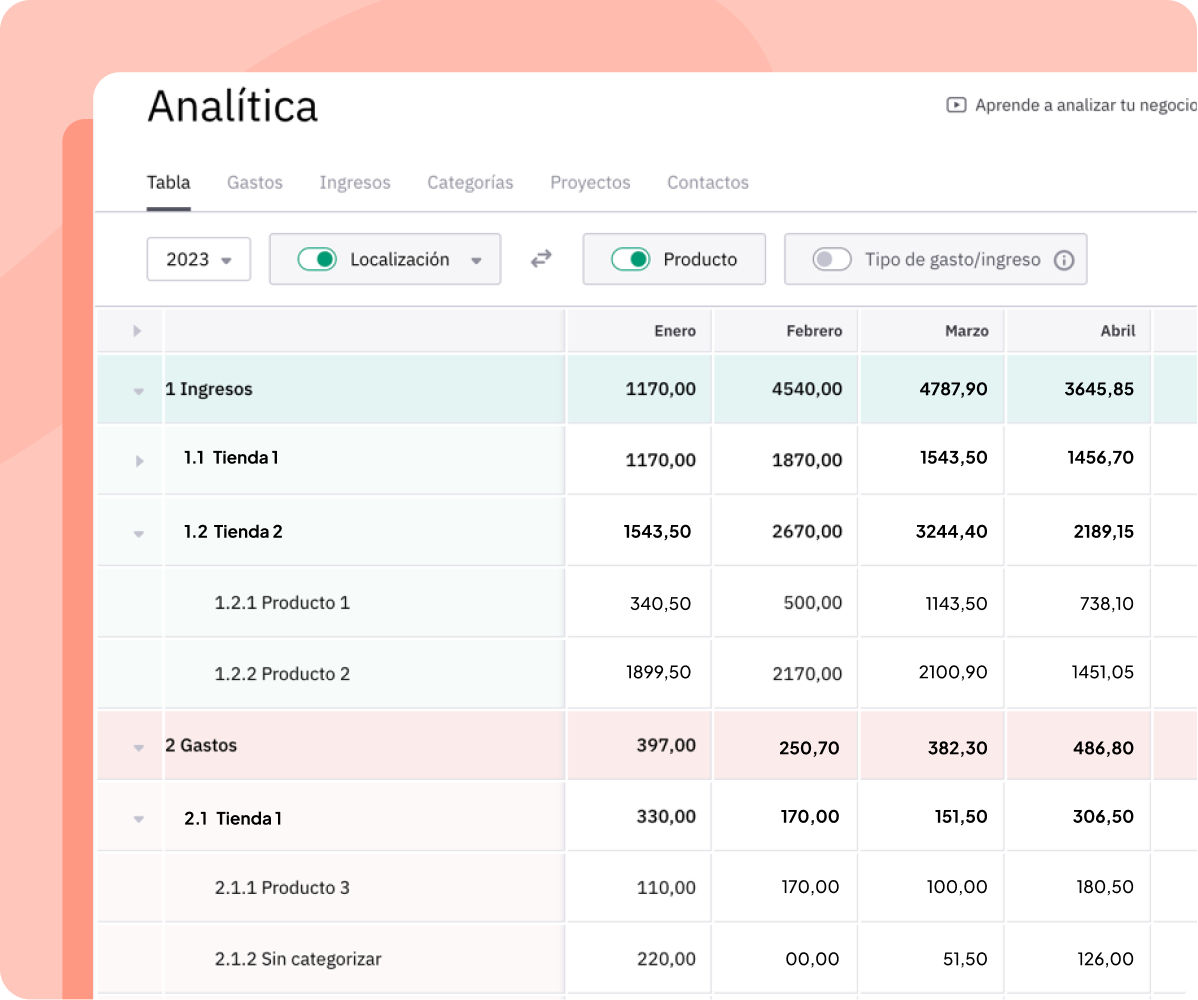
Monthly income, expenses and gross margin (income - expenses) are displayed in table format and broken down by the categories, projects and products configured.
Revenues and expenses that do not have any classification are added to the "uncategorized expenses" category so that they do not interfere with the analysis of the specified categories, but are taken into account for the overall analysis.
When you create an income or expense associated to that contact, it will be automatically assigned to the configured categories or projects.
This way, you won't have to add categories and projects manually every time you create or receive an invoice.
The information displayed in the analytics table is automatically updated each time an income or expense is added to the program.
OTHER FUNCTIONALITIES


We offer modern solutions for businesses to keep their business information up to date, effortlessly, in an intuitive and complete platform.

Carrer Pere IV, 78-84, 6-5, 08005 Barcelona

support@getquipu.com
935 245 580
Monday to Friday from 9 a.m. to 2 p.m. and from 3 to 6 p.m.